

Excel was developed by Microsoft in 1985, with the sole purpose of helping businesses create spreadsheets to compile all their financial data, yearly credit, and yearly debit sheets. But today, the program is used in very flexible ways and include functions, formulas, and shortcuts that can be used to enhance its functionality. Bobcats get Excel for free as part of Microsoft 365, and can work online or download the app to their computers. Let’s take a look at some uses for Excel:
Conditional Formatting
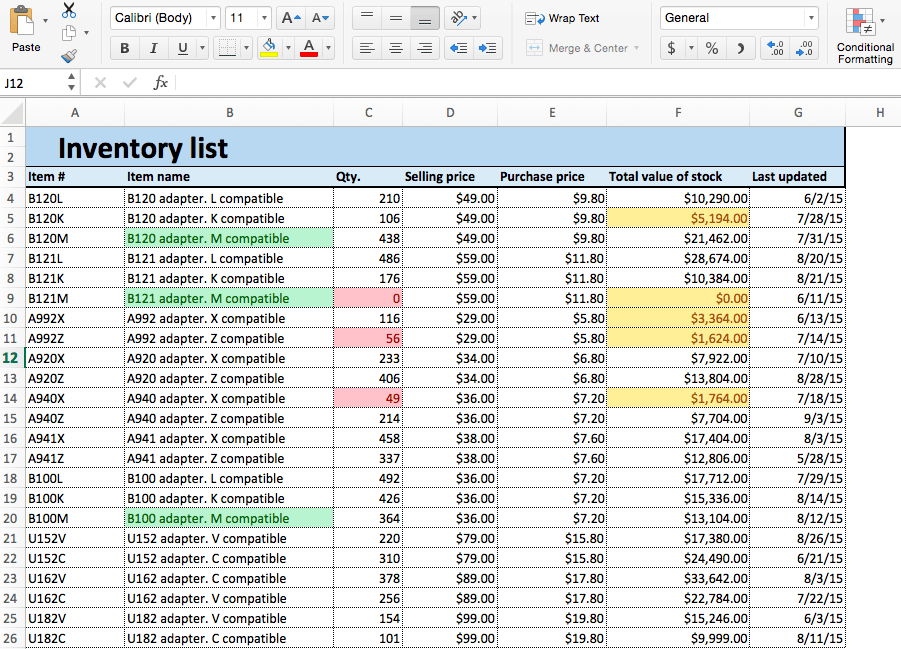
Conditional formatting is a feature in Excel that enables you to highlight cells with a certain color, depending on the cell’s value and have that formatting change depending on the value of the cell or of the formula. It is most often used as color-based formatting to highlight, emphasize, or differentiate among data and information stored in a spreadsheet. This feature brings out the patterns that are captured by your spreadsheet.
Pivot Tables
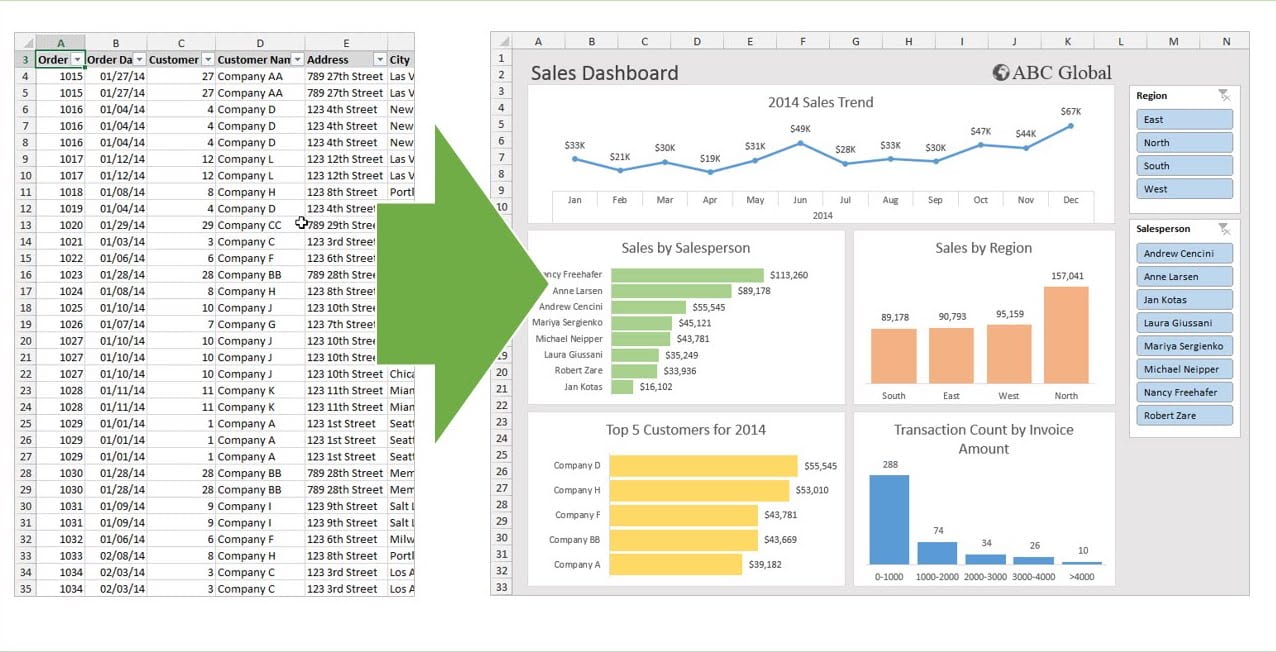
A pivot table is a summary of your data, packaged in a chart that lets you report on and explore trends based on your information, it helps to summarize data in a quick and easy manner. Pivot tables are particularly useful if you have long rows or columns that hold values you need to track the sums of and easily compare to one another. With the help of these tables, you can summarize large amounts of information into a small space.
Paste Special
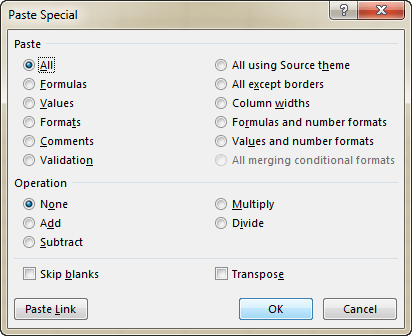
Excel Paste Special makes the pasting operation smoother by letting you choose which formatting to keep or by stripping all formatting and just pasting the values or formulas. For example, you can copy formula-driven data and paste only the calculated values in the same or different cells. Or, you can copy the width of one column and apply it to all other columns in your data set.
Formulas and Functions
A formula is an expression that calculates the value of a cell. Formulas are a powerful way to capture and save a working solution. They let you repeat the solution again whenever you like, always with perfect accuracy. Having an understanding of formulas helps you design better spreadsheets. You can organize data in a way that takes advantage of formulas, which drastically reduces errors and troubleshooting. Here’s a basic way to use a formula:
- Select a cell.
- To let Excel know that you want to enter a formula, type an equal sign (=).
- For example, type the formula A1+A2.
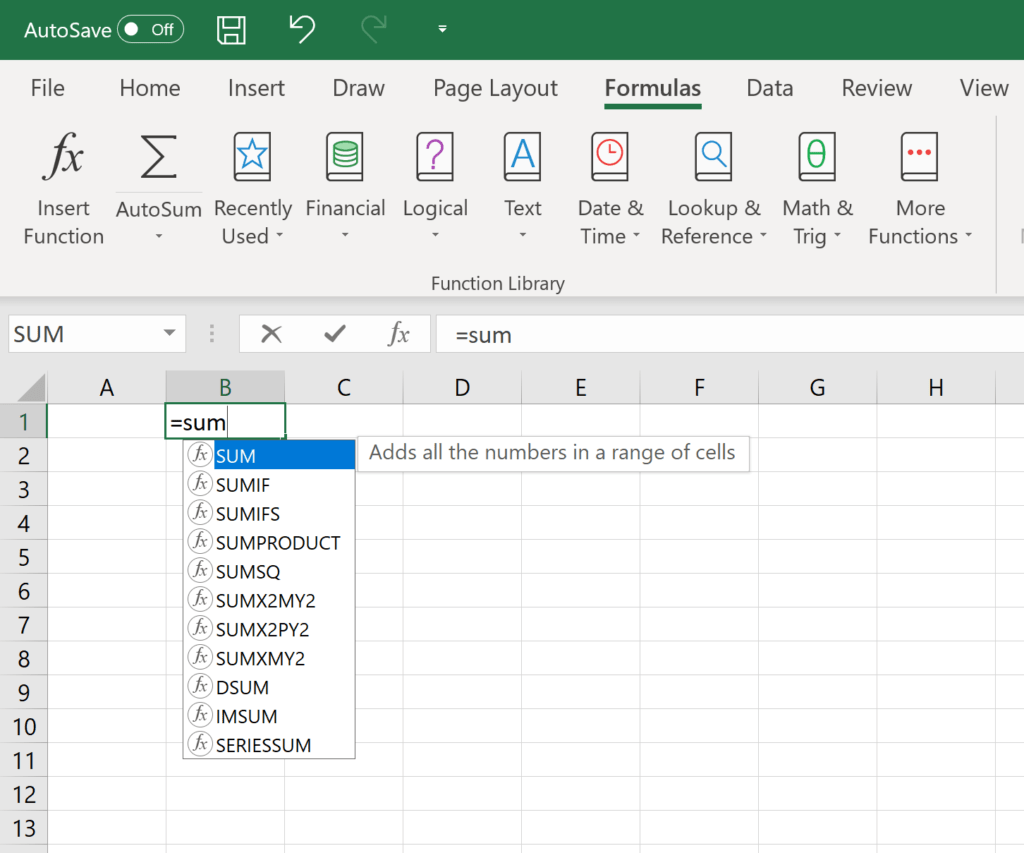
A function is a predefined formula that performs calculations using specific values in a particular order. Excel includes many common functions that can be used to quickly find the sum, average, count, maximum value, and minimum value for a range of cells. Here are some of the basic, but frequently used functions:
- SUM – SUM allows you to sum any number of columns or rows by selecting them or typing them in
- COUNT – COUNT counts the number of cells in an array that have a number value in them. This would be useful for maybe determining if someone has paid, or in other database situations.
- AVERAGE – AVERAGE does exactly what it sounds like and takes the average of the numbers you input.
- IF – The IF function checks whether a condition is met and returns one value if true and another value if false.
Chantal Lesley is a marketing and communications specialist student employee in the IT Marketing and Communications office.
